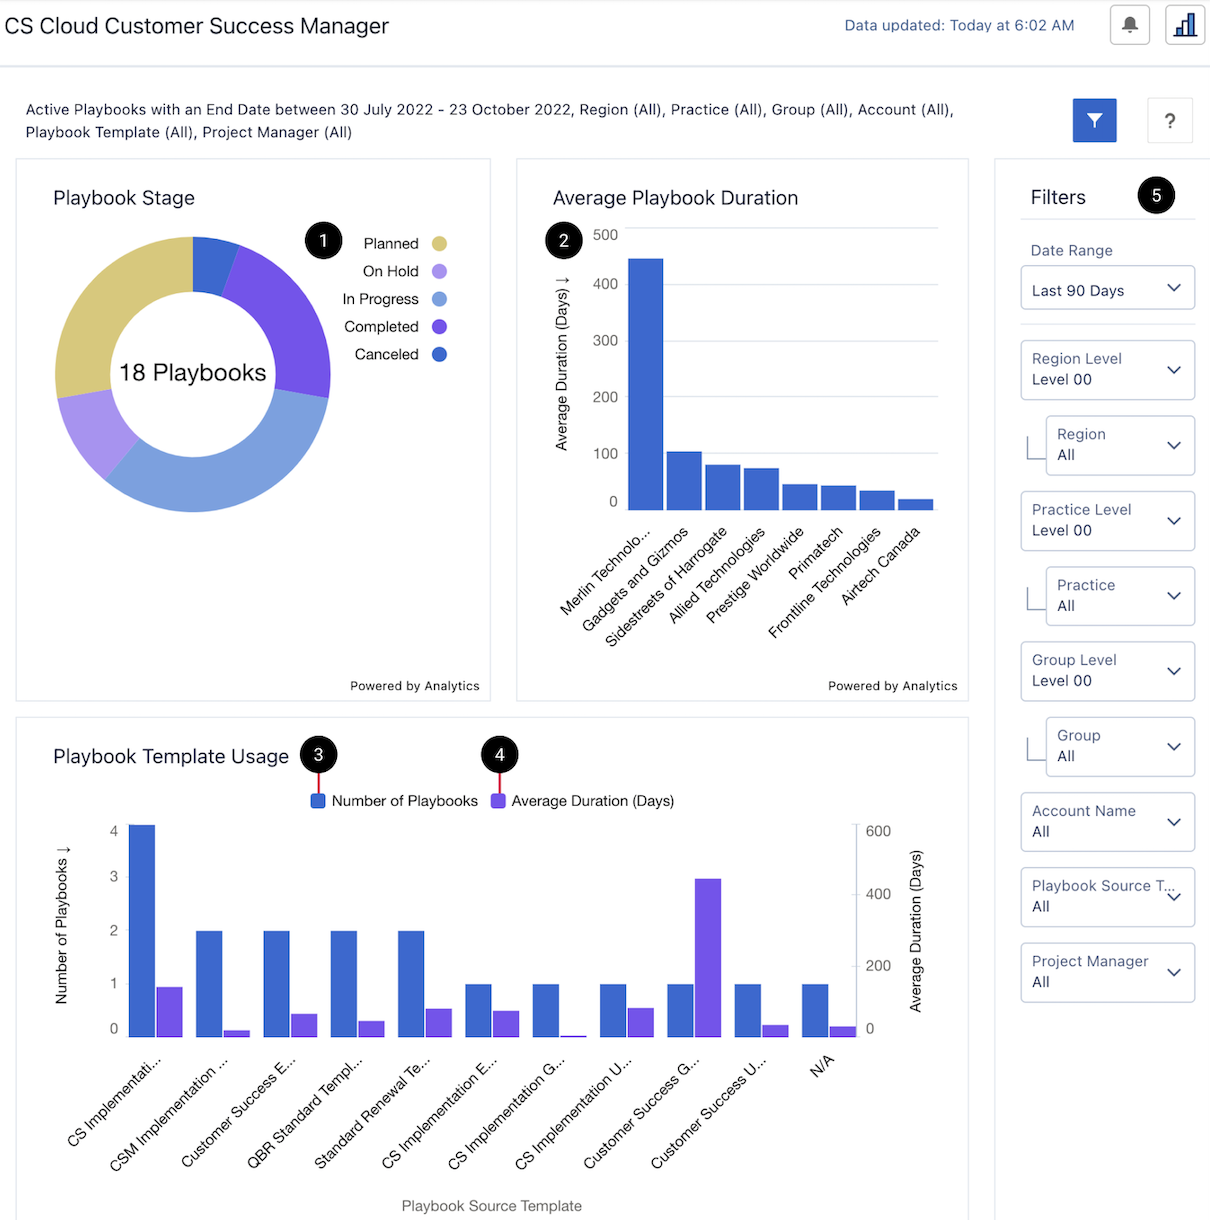
CS Cloud Customer Success Manager Dashboard
The CS Cloud Customer Success Manager dashboard enables you to view information about playbooks, using data derived from the Project Reporting dataset. This dashboard is designed to be embedded in the Customer Success Cloud Workspace.
This dashboard is created as part of the PS Cloud Core Analytics app.
Prerequisites
To create this dashboard you must have Customer Success Cloud Winter 2023 installed and have the playbook project record type set up in your org.
Suggested Use Cases
Data displayed in this dashboard can help you perform the following tasks:
- View the stage of active playbooks.
- View the average duration of active playbooks.
- View the count and duration of playbooks created from a playbook template.
Dashboard Overview
The CS Cloud Customer Success Manager dashboard contains the following elements:

|
Key |
Name |
Description |
Calculation |
Referenced Calculation |
Source Dataset |
|---|---|---|---|---|---|
| 1 | Playbook Stages | Displays active playbooks grouped by their stage. A total count of active playbooks is displayed in the center of the chart. Clicking on stage sections in this chart facets the data displayed in the dashboard. |
Count of Projects
Filters:
Group: Stage |
Project Reporting See Project Reporting Dataset PS Cloud Analytics Output Fields |
|
| 2 | Average Playbook Duration | Displays the average duration (Start Date to End Date) of active playbooks grouped by account. Clicking on bars in this chart facets the data displayed in the dashboard. |
Average (Duration)
Filters:
Order: Descending
Limit: 10
Group: Account Name |
Referenced Field: Duration__c |
|
| 3 | Playbook Template Usage Number of Playbooks Bar Chart | Displays the count of playbooks created from playbook templates. Clicking on these bars facets the data displayed in the dashboard. |
Count of Projects Filters:
Order: Descending
Limit: 20
Group: Project Source Template Name |
||
| 4 | Playbook Template Usage Average Duration (Days) Bar Chart | Displays the average duration (Start Date to End Date) of the active playbooks created from playbook templates in days. Clicking on these bars facets the data displayed in the dashboard. |
Average (Duration)
Filters:
Limit: 20
Group: Project Source Template Name |
Referenced Field: Duration__c |
|
| 5 | Filter Panel |
Refines the data displayed in the dashboard. |
Embedding the Dashboard
This dashboard is designed to be embedded in the CS Cloud Workspace. For more information on how to embed the CS Cloud Customer Success Manager dashboard, see Embedding PS Cloud Analytics Dashboards in a Lightning Page.
 SECTIONS