PSA Capacity and Demand Planning Dashboard
The PSA Capacity and Demand Planning dashboard displays data from the Capacity dataset.
This dashboard is created as part of the PS Cloud Advanced Analytics app.
This dashboard enables you to:
- View demand and capacity of roles by Region, Practice or Group.
- View a breakdown of capacity for your selected date range by Assigned, Held Requests, Unheld Requests and Available Capacity.
- View resources and their capacity hours for your selected date range and role.
- Drill through to view details of resources in PSA.
Suggested Use Case
You want to see if you have enough capacity to cover demand, including your unheld resource requests. Use the dashboard to review how this demand affects your capacity by role, and how you might fulfill this demand with available resources.
For more details of the fields used by the PSA Capacity and Demand Planning dashboard, see Capacity Dataset PS Cloud Analytics Output Fields.
The calculations used in this dashboard use fields derived from the Utilization Summary object and Utilization Detail objects. In order to use this dashboard, you must configure PSA to create utilization summary records. For more information see Utilization Settings in the PSA Help.
 Managing Filters
Your filter selections determine the data displayed on the dashboard. To set or change your filters, use the following drop-down options:
- Date Range: select the time period you want to view data for. By default, a date range covering the next 90 days is selected. You can select between fiscal year, fiscal quarter, calendar year, calendar quarter, calendar month, and day. You can also select all time or custom to input the time period of your choosing. Time periods are based on values derived from the Time Period End Date field.
Your selected date range will include all utilization records with an end date that occurs within this range, using the end date specified on the Time Period End Date field for each utilization record.
- Utilization Calculation: select the utilization calculation you want to view data for. You can select multiple utilization calculations to visualize in the dashboard charts. By default, only utilization calculations with the field Is Report Master selected are available for selection. If you want to display utilization calculations that do not have the field Is Report Master selected, you must manually edit the step for this filter in Analytics Studio. By default, the first alphabetically-listed Utilization Calculation is displayed.
- If you select multiple utilization calculations using the Utilization Calculation filter, you must ensure that your calculations are configured appropriately to avoid double counting. For more information on creating utilization calculations, see Utilization Calculations Overview.
- Time Period Type: select the time period type you want to group the data by. Only the time period types available for the selected utilization calculation are displayed. For example, if you create and select a calculation that uses both weekly and monthly time period types, you can only select between those two time period types for this filter.
- Region Level: select the Regional Level you want to filter your data by. Selections here determine the region options displayed under "Region".
- Region: select the Region you want to filter your data by.
- Practice Level: select the Practice Level you want to filter your data by. Selections here determine the practice options displayed under "Practice".
- Practice: select the Practice you want to filter your data by.
- Group Level: select the Group Level you want to filter your data by. Selections here determine the practice options displayed under "Group".
- Group: select the Group you want to filter your data by.
- Role: view your scheduled utilization data by grouping it according to the roles of the assigned resources. Roles displayed by this filter are determined by your selections made using the Utilization Calculation filter.
Region, Practice and Group Filters
The data displayed by these filters is determined by your selected utilization calculation. For more information, see Calculating Utilization in the PSA Help. By default, no data is displayed for the Region, Practice and Group filters until a selection is made.
Data Structure
The data displayed in the PSA Capacity and Demand Planning dashboard is organized using the following types, subtypes and measures:
|
Scheduled Scheduled Held |
Unheld |
Remaining |
|
|---|---|---|---|
|
Type:
Subtype:
Measure:
*Derived from the Utilization Summary object. |
Type:
Subtype:
Measure:
|
Type:
Measure:
|
|
PSA Capacity and Demand Planning Dashboard
Refer to the schematics below for details of dashboard elements.
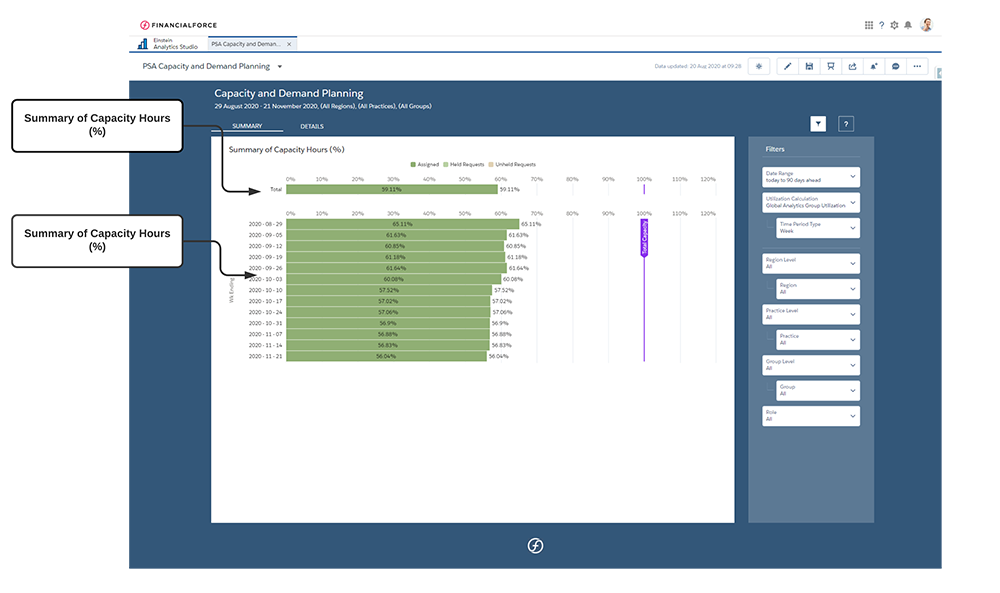

PSA Capacity and Demand Planning Dashboard Pages
The dashboard contains the following pages and tabs:
- Summary
- Details. Contains the tabs Availability and Demand.
PSA Capacity and Demand Planning Dashboard Charts
The PSA Capacity and Demand Planning dashboard contains the following charts:
Faceting is not applied between charts displayed on different pages and tabs in this dashboard. You can only facet between charts on the same page and tab.
For example, faceting applied to charts on the Availability tab on the Details page are not applied to the Demand tab on the Details page.
For more information about dashboard functionality, see Using the Dashboards Charts.
Drilling Through to Resources
To drill through to view details of resources in PSA from the Resources table:
- Hover over a cell in the Resource Name column in the table.
- Click the
 that appears, then click Open Record.
 - The related resource opens in a new PSA tab.