| 1. |
Project Details
|
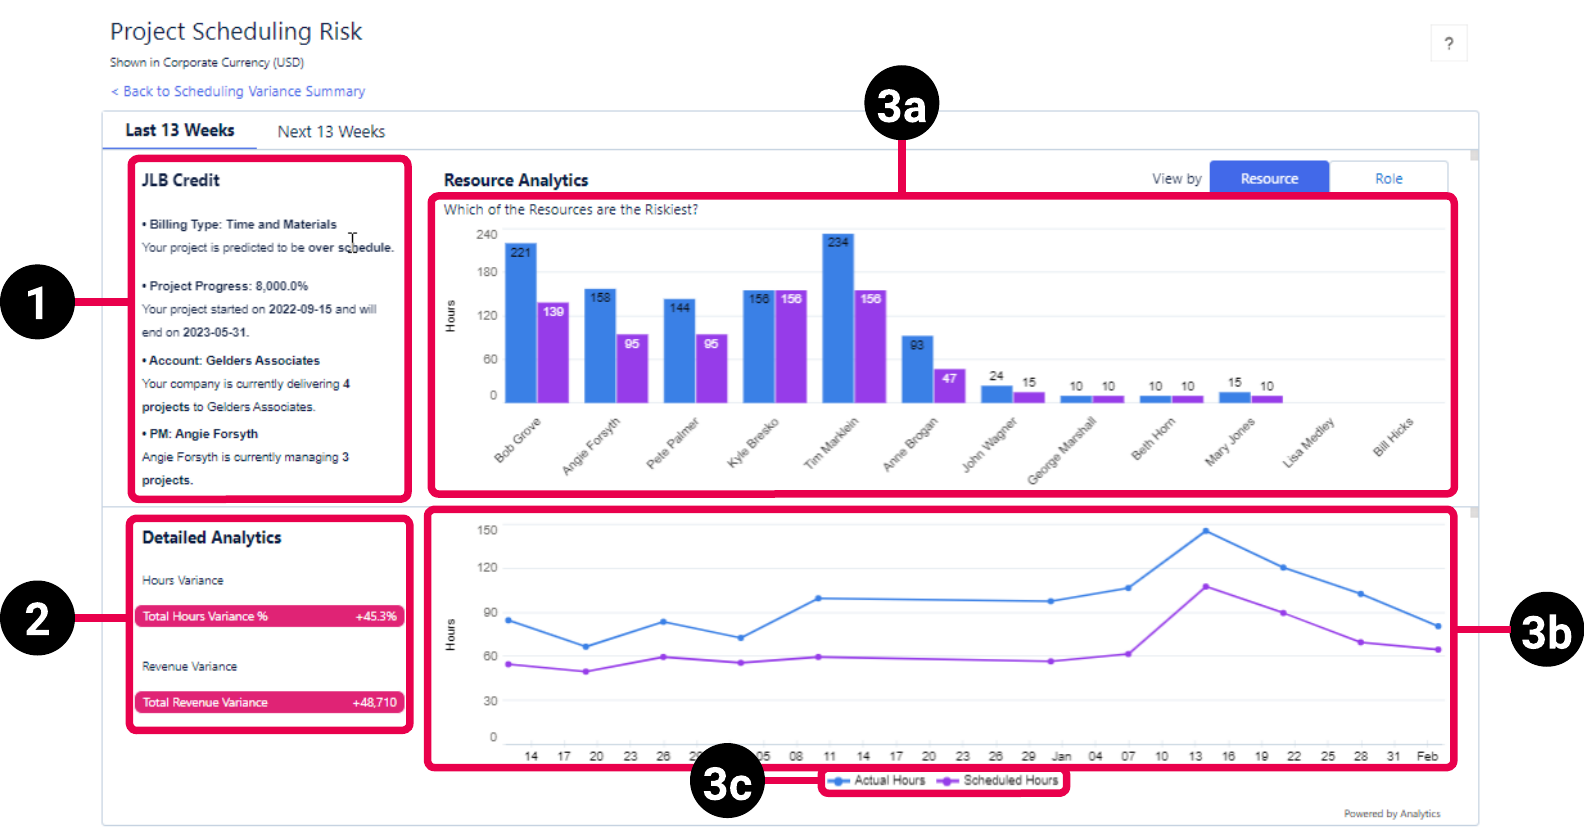
Displays the following information about the selected project:
- Project Name
- Billing Type
- Project Progress, which is expressed as a percentage, along with the start and end date of the project
- Account
- PM
|
If you have planned hours for the project, then project progress percentage is calculated as:
Total Submitted hours / Planned Hours
If you don't have planned hours for the project, then project progress percentage = Project Percent Hours Complete
|
|
|
| Resource Analytics - Last 13 Weeks
|
| 2. |
Detailed Analytics
|
Displays variance information for the last 13 week as follows:
- Total Hours Variance %, which is the difference between the scheduled and actual hours for the last 13 weeks
- Total Revenue Variance, which is the difference between the estimated and actual revenue for the last 13 weeks
|
Total Hours Variance % = (Actual Hours - Scheduled Hours) / Scheduled Hours Total Revenue Variance = Last 13 weeks Actual Revenue - Last 13 weeks Estimated Revenue |
Total Hours % Variance = (EvA Actual Hours - EvA Estimated Hours) / EvA Estimated Hours
or
EvA Hours Variance / EvA Estimated Hours
Total Revenue Variance = EvA Actual Billable Amount - EvA Scheduled Amount
|
|
| 3a. |
Resource Analytics - Bar Chart - Last 13 Weeks
|
Displays the actual and scheduled hours for each resource assigned to the project for the last 13 weeks in a bar chart. The resource with the greatest variance in actual versus scheduled hours is listed furthest left. Click on the bars for each resource to get the total hours variance % and total revenue variance.
|
|
|
|
| 3b. |
Resource Analytics - Hours Variance Trend - Last 13 Weeks
|
Displays the actual and scheduled hours for the project for the last 13 weeks in a line chart.
|
|
|
|
| 3c. |
Chart Legend |
Legend for the information displayed in the bar and line charts, which consists of actual and scheduled hours information for the resources assigned to the project, and for the project overall. |
Actual Hours = EvA Actual Hours Scheduled Hours = EvA Estimated Hours |
|
|
| Role Analytics - Last 13 Weeks
|
| 4. |
Detailed Analytics |
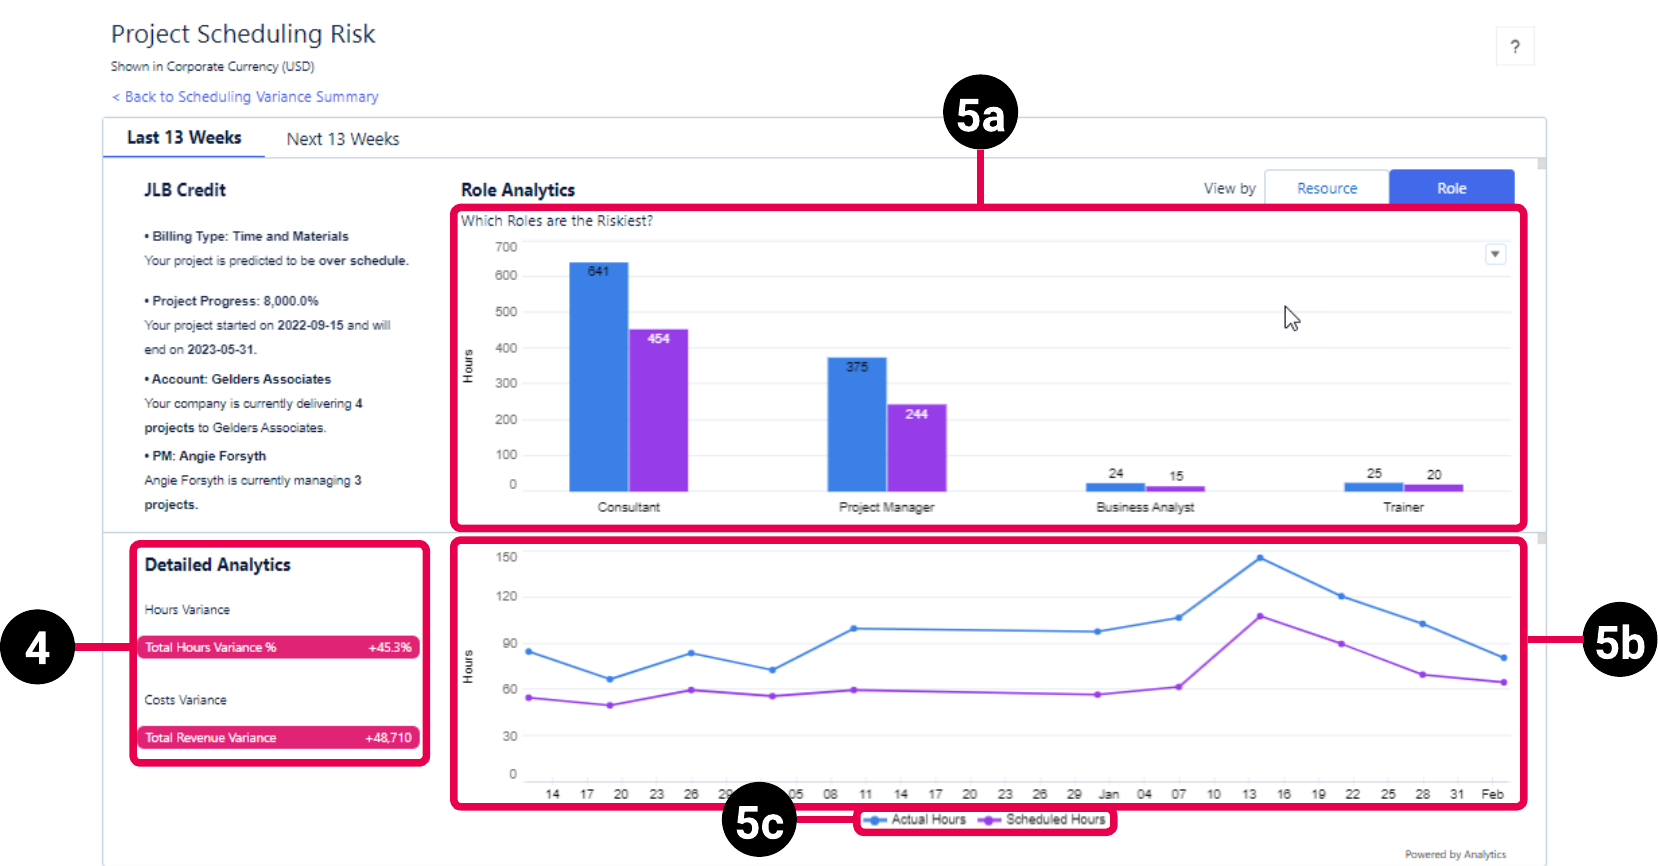
Displays variance information for the last 13 week as follows:
- Total Hours Variance %, which is the difference between the scheduled and actual hours for the last 13 weeks
- Total Revenue Variance, which is the difference between the estimated and actual revenue for the last 13 weeks
|
Total Hours Variance % = (Actual Hours - Scheduled Hours) / Scheduled Hours Total Revenue Variance = Last 13 weeks Actual Revenue - Last 13 weeks Estimated Revenue |
Total Hours % Variance = (EvA Actual Hours - EvA Estimated Hours) / EvA Estimated Hours
or
EvA Hours Variance / EvA Estimated Hours
Total Revenue Variance = EvA Actual Billable Amount - EvA Scheduled Amount
|
|
| 5a. |
Role Analytics - Bar Chart - Last 13 Weeks
|
Displays the actual and scheduled hours for each project role for the last 13 weeks in a bar chart. The role with the greatest variance in actual versus scheduled hours is listed furthest left. Click on the bars for each role to get the total hours variance % and total revenue variance.
|
|
|
|
| 5b. |
Role Analytics - Hours Variance Trend - Last 13 Weeks
|
Displays the actual and scheduled hours for the project for the last 13 weeks in a line chart.
|
|
|
|
| 5c. |
Chart Legend |
Legend for the information displayed in the bar and line charts, which consists of actual and scheduled hours information for the project roles, and for the project overall. |
Actual Hours = EvA Actual Hours Scheduled Hours = EvA Estimated Hours |
|
|
| Resource Analytics - Next 13 Weeks
|
| 6. |
Detailed Analytics |
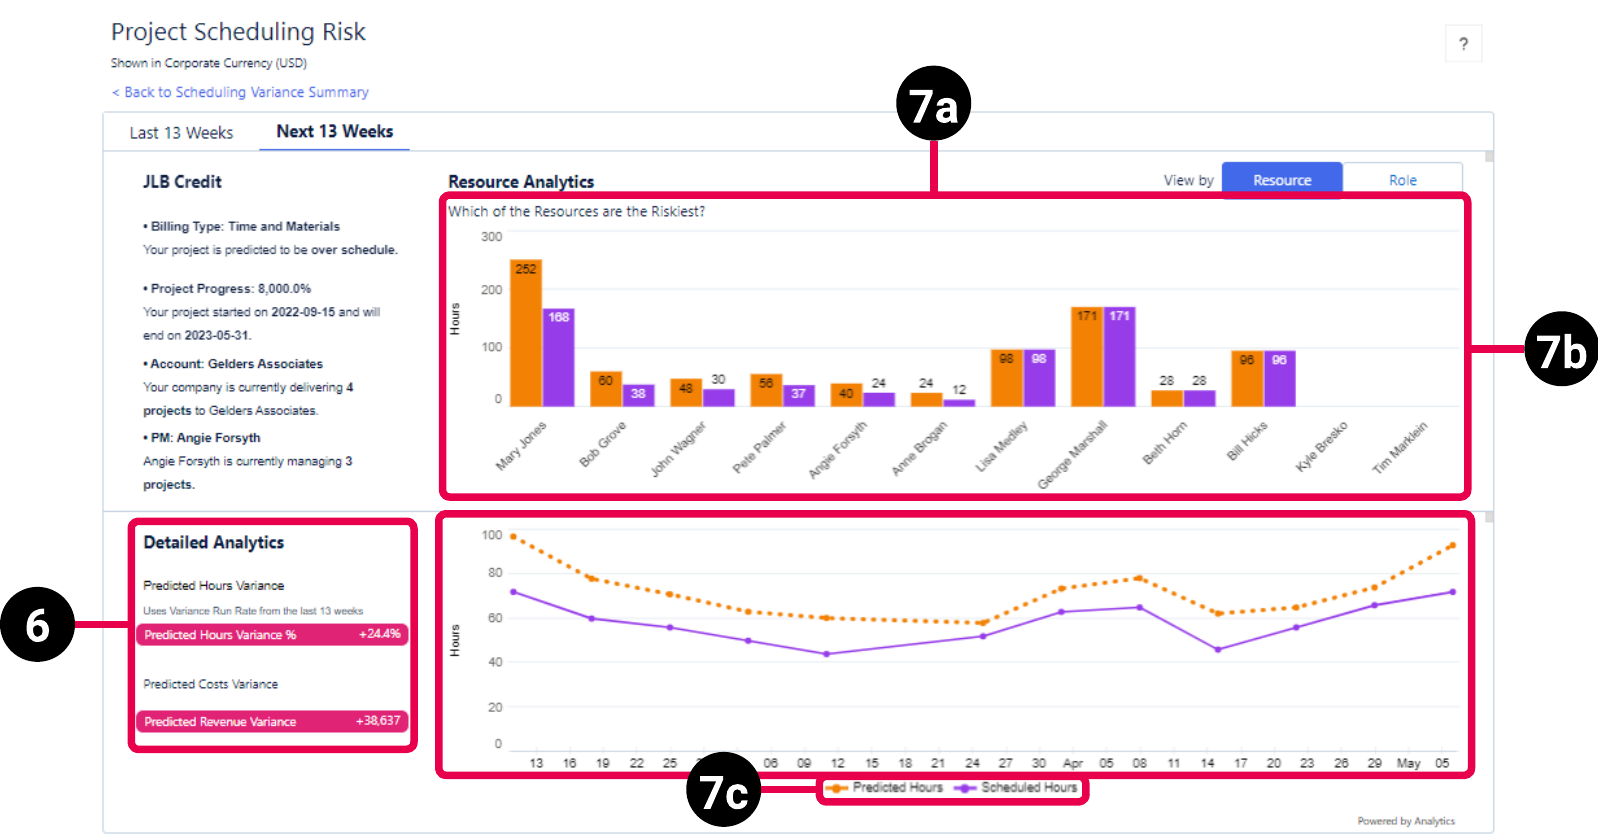
Displays predicted variance information for the next 13 week as follows:
- Predicted Hours Variance %, which is the difference between the scheduled and predicted hours for the next 13 weeks
- Predicted Revenue Variance, which is the difference between the estimated and predicted revenue for the next 13 weeks
|
Predicted Hours Variance % = Predicted Hours Variance / Scheduled Hours Predicted Revenue Variance = Predicted Revenue - Estimated Revenue |
Predicted Hours Variance = EvA Estimated Hours (future) * (EvA Hours Variance (past) / EvA Estimated Hours (past))
Scheduled Hours = EvA Estimated Hours
Predicted Revenue = EvA Scheduled Amount * Average Variance % for the last 13 weeks
Estimated Revenue = EvA Scheduled Amount
|
|
| 7a. |
Resource Analytics - Bar Chart - Next 13 Weeks
|
Displays the predicted and scheduled hours for each resource assigned to the project for the next 13 weeks in a bar chart. Predicted hours are based on the actual hours for the resource for the last 13 weeks. The resource with the greatest variance in predicted versus scheduled hours is listed furthest left. Click on the bars for each resource to get the predicted hours variance % and predicted revenue variance.
|
|
|
|
| 7b. |
Resource Analytics - Hours Variance Trend - Next 13 Weeks
|
Displays the predicted and scheduled hours for the project for the next 13 weeks in a line chart. Predicted hours are based on the actual hours for the project for the last 13 weeks.
|
|
|
|
| 7c. |
Chart Legend |
Legend for the information displayed in the bar and line charts, which consists of predicted and scheduled hours information for the resources assigned to the project, and for the project overall. |
Predicted Hours = EVA Estimated Hours - (Average Variance % for last 13 weeks * EVA Estimated Hours) Scheduled Hours = EvA Estimated Hours |
|
|
| Role Analytics - Next 13 Weeks
|
| 8. |
Detailed Analytics |
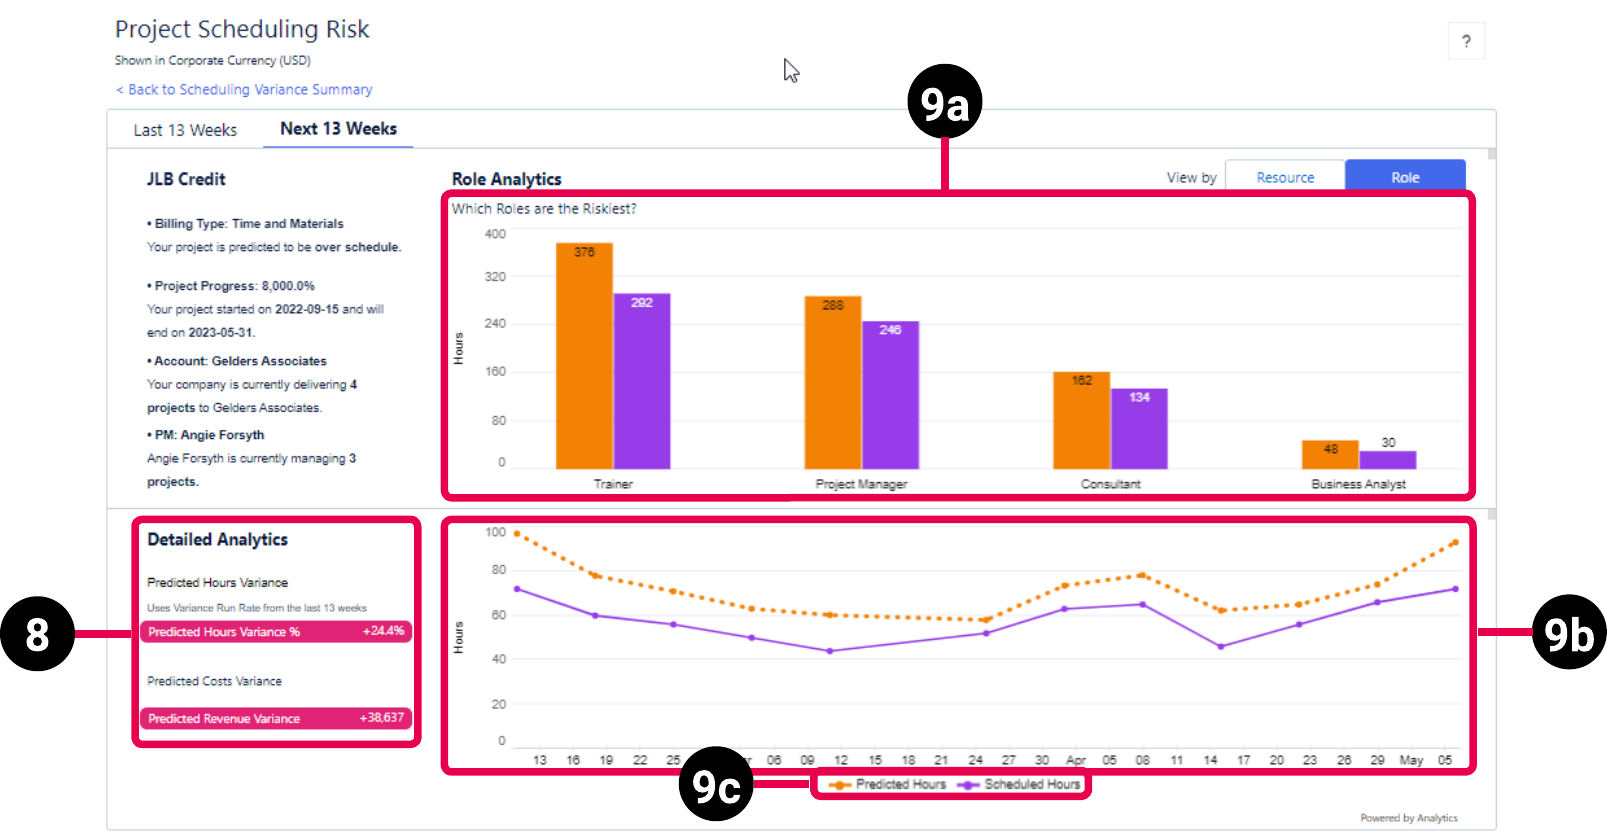
Displays predicted variance information for the next 13 week as follows:
- Predicted Hours Variance %, which is the difference between the scheduled and predicted hours for the next 13 weeks
- Predicted Revenue Variance, which is the difference between the estimated and predicted revenue for the next 13 weeks
|
Predicted Hours Variance % = Predicted Hours Variance / Scheduled Hours Predicted Revenue Variance = Predicted Revenue - Estimated Revenue |
Predicted Hours Variance = EvA Estimated Hours (future) * (EvA Hours Variance (past) / EvA Estimated Hours (past)) Scheduled Hours = EvA Estimated Hours Predicted Revenue = EvA Scheduled Amount * Average Variance % for the last 13 weeks Estimated Revenue = EvA Scheduled Amount |
|
| 9a. |
Role Analytics - Bar Chart - Next 13 Weeks
|
Displays the predicted and scheduled hours for each project role for the next 13 weeks in a bar chart. Predicted hours are based on the actual hours for the resource for the last 13 weeks. The role with the greatest variance in predicted versus scheduled hours is listed furthest left. Click on the bars for each role to get the predicted hours variance % and predicted revenue variance.
|
|
|
|
| 9b. |
Role Analytics - Hours Variance Trend - Next 13 Weeks
|
Displays the predicted and scheduled hours for the project for the next 13 weeks in a line chart. Predicted hours are based on the actual hours for the project for the last 13 weeks.
|
|
|
|
| 9c. |
Chart Legend
|
Legend for the information displayed in the bar and line charts, which consists of predicted and scheduled hours information for the project roles, and for the project overall.
|
Predicted Hours = EVA Estimated Hours - (Average Variance % for last 13 weeks * EVA Estimated Hours)
Scheduled Hours = EvA Estimated Hours
|
|
|


 SECTIONS