 SECTIONS
PSA Project Burnup Dashboard
The PSA Project Burnup dashboard enables you to:
- View project scope and how much work has been delivered and billed.
- Compare your projects' billings to the budget over the duration of the project.
- Compare your projects' hours to the project planned hours over the duration of the project.
- Get a breakdown of your project's billed hours, milestones, expenses, and miscellaneous adjustments by month
The dashboard is created as part of the PS Cloud Core Analytics app and displays data from the Billings dataset. For more details of the fields used by the PSA Project Burnup dashboard, see Billings Dataset PS Cloud Analytics Output Fields.
PSA Project Burnup Dashboard Guide
The charts in the PSA Project Burnup dashboard group the estimates vs actuals (EVAs) data from the billings dataset using their related time period type. By default the dashboard gives preference to the month time period type, and if this is not available it uses the following priority:
- Month (Default)
- Week
- Quarter
- Year
- Other
The dashboard contains the following elements.

|
Element Number |
Name |
Description |
Calculation |
Referenced Calculation |
Source Dataset |
|---|---|---|---|---|---|
| 1. | Budget |
Total amount of the project’s budget records, including the following budget types and their respective change requests:
The change requests for each type contributes to the total cumulative budget. For example, the budget for a project with a budget type of customer purchase order is 50,000 USD. If you add a customer purchase order change request for 10,000 USD, the total cumulative budget of 60,000 USD is displayed on the dashboard. |
Filtered by
Type = ”Budget”
Measure = Billings Value, Group by Subtype |
|
Billings For more information, see Billings Dataset PS Cloud Analytics Output Fields. |
| 2. | Projected | Total projected billings amount for the project. | Actual + Scheduled | See detail for Actual and Scheduled below. | |
| 3. | Actual | Actuals to date on project, broken down on the bar by timecards, milestones, misc adjustments, expenses. | Filtered by Subtype = “Actual” Measure = Billings Value Group by Type | Type gives you the breakdown of type of actuals. For example, timecards, milestones, misc adjustments, expense. | |
| 4. | Scheduled | Remaining scheduled (future periods only). |
Filtered by Subtype = “Scheduled” Measure = Billings Value
Note: See Help topic ‘Billings Flow Intermediate Processing’ for notes on currency handling for Billings Value (ValueBillings) |
Scheduled value come from Est v Actuals object type Billings value explanation: see above (1). | |
| 5. Project Trend line graph | |||||
| 6. | Project Currency/Corporate Currency |
View project burnup data in project currency or corporate currency. |
|||
| 7. | Budget line | Shows total budget for the project including change orders. | Filter by Subtype= “Budget” Measure=Billings Value Group | Billings Value here is the Amount field from the budget object in PSA. | 6 |
| 8. | Actual line | Shows cumulative actuals to date. If required, current month can be displayed as actual data. For more information on choosing your current month display, see [BAN-33432]Using the PSA Project Burnup Plus Dashboard Configuration Page. | Filter by Subtype= “Actual” Measure=Billings Value Group by End Date | End Date is a field in Billings dataset which is calculated depending on what ‘type’ of record: For Timecards, the end date is the timecard split End Date field. For Expenses, the end date is the Expense Date field. For Misc. Adjustments, the end date is the Effective Date field. For Milestones, if the subtype is actual the end date is the Actual Date field. If the subtype is scheduled the end date is the Target Date field. For Estimates Vs. Actuals, the end date is the End Date field. | |
| 9. | Scheduled line | Shows scheduled values for future periods only. If required, current month can be displayed as scheduled data. For more information on choosing your current month display, see [BAN-33432]Using the PSA Project Burnup Plus Dashboard Configuration Page. | Filter by Subtype = “Scheduled” Measure = Billings Value Group by End Date This value is cumulative | End Date explanation: see above (6) | |
| 10. | Billings Distribution bar chart |
Periodic view of billings amount for actuals and scheduled values. The actuals and scheduled values include sub categories and they are the same as that of KPIs. The actuals and scheduled values include sub categories and they are the same as that of KPIs. For more information, see PSA Project Burnup Billings and Hours KPI. |
Filter by Type is not “Budget” Measure = Billings Value Group by End Date (by month) and Subtype | Billings Value explanation: see above (1) End Date explanation: see above (6) | |
|
Element Number |
Name |
Description |
Calculation |
Referenced Calculation |
Source Dataset |
|---|---|---|---|---|---|
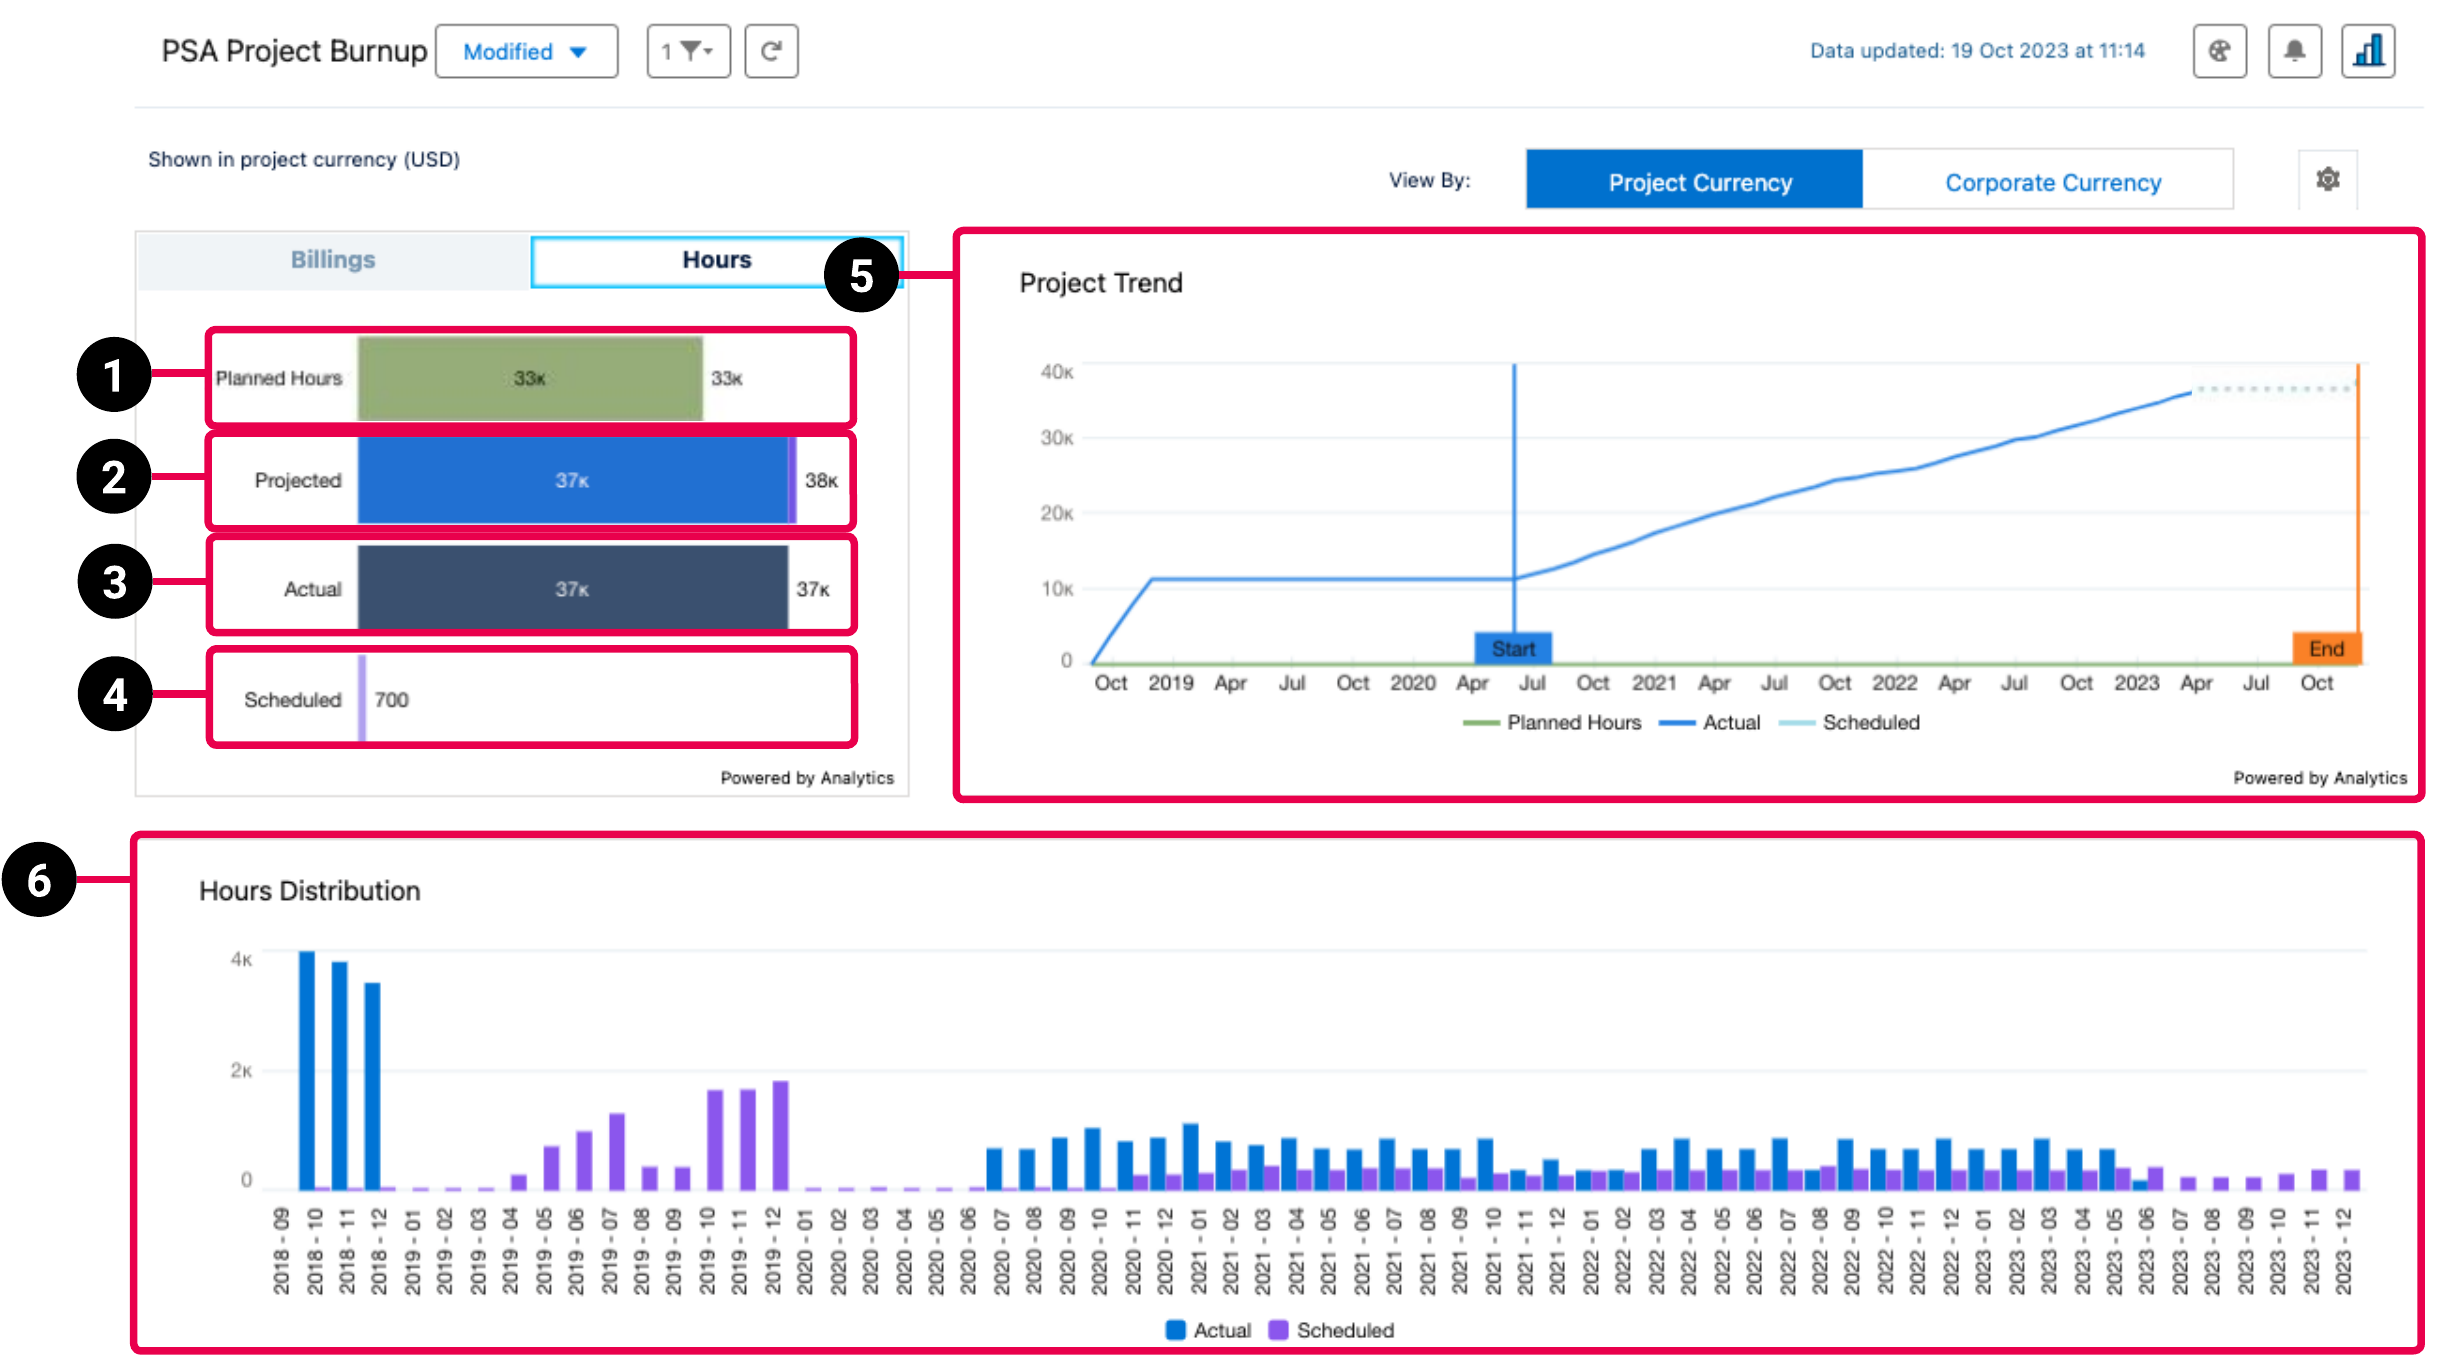
| 1. | Planned Hours |
Filter by Subtype = “Actual” Measure = Total Hours Group by Type |
Filter by Type=”Budget” Measure=Total Hours | Total Hours is a calculated field in the Billings dataset. For Budgets, the dataflow uses the project's planned hours field. For Estimates Vs. Actuals, this is the Estimated Hours Field. For Milestones, this is the Billable Hours in Financials field. For Misc. Adjustments, and Expenses, this value is zero. For Timecards, this is the Total Hours Field. | Billings |
| 2. | Projected | Total projected hours for the project. | Actual + Scheduled | See detail for Actual and Scheduled below. | |
| 3. | Actual | Total cumulative actual hours for the project. |
Filter by Subtype= “Actual” Measure=Total Hours Group by Type | ||
| 4. | Scheduled | Total remaining scheduled hours for the project. | Filter by Subtype= “Scheduled” Measure=Total Hours Group by Type | ||
| 5. | Project Trend line graph |
Cumulative actual hours to current period, scheduled hours for future periods of the project versus planned project hours. Current month can be displayed as actual or scheduled data. For more information on choosing your current month display, see [BAN-33432]Using the PSA Project Burnup Plus Dashboard Configuration Page. |
Filter by Subtype= “Budget”or “Actual” or “Scheduled’ Measure=Total Hours Group by End Date | ||
| 6. | Hours Distribution bar chart | Periodic view of hours for actuals and scheduled values. The actuals and scheduled values include sub categories and they are the same as that of KPIs. For more information, see PSA Project Burnup Billings and Hours KPI. | “Budget” Measure=Total Hours Group by End Date (by month) and Subtype |
PSA Project Burnup Buttons and Selectors
The PSA Project Burnup has the following buttons and selectors.
| Button or Selector | Description |
|---|---|
| Corporate Currency/Project Currency | Toggle this button to view the dashboard in corporate currency or project currency. |
| Billings | Switches the type of data to display billings. |
| Hours | Switches the type of data to display hours. |

|
Opens the dashboard's configuration page. |
PSA Project BurnupBillings and Hours KPIs
|
KPI |
Subcategory |
|---|---|
|
Budget |
|
| Projected |
|
| Actual |
|
| Scheduled |
|