 SECTIONS
PSA Revenue Forecast Dashboard
This dashboard enables you to:
- Embed analytics to display forecasted revenue broken down by actual, scheduled and unscheduled revenue.
- View comparisons of your live forecast against a saved version, or comparisons of two saved versions.
- Filter forecast versions by expected, best and worst case scenarios.
- View the value of adjustments made to projects, opportunities and milestones, or aggregated adjustments at RPG level.
PSA Revenue Forecast Dashboard Guide
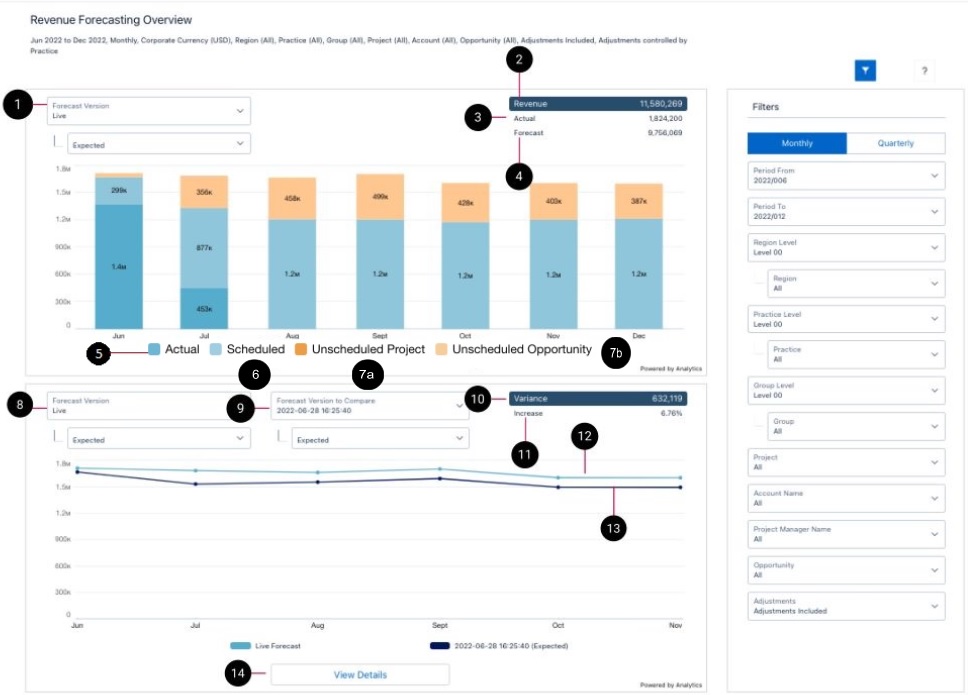
The PSA Revenue Forecast Overview contains the following elements.
|
Element Number |
Name |
Description |
Calculation |
Referenced Calculation |
Source Dataset |
|---|---|---|---|---|---|
| 1 | Forecast Version | You can select either a saved Forecast Version or the Live Forecast Version. Live is your most recent calculated forecast and can be used to display current actuals. | Forecast Name
|
Revenue Forecast
See Revenue Forecast Dataset PS Cloud Analytics Output Fields for more information. |
|
| 2 | Revenue (Expected) | Displays Total Revenue for your selected Forecast Version and Case. | (Actual + Forecast) | Actual Value + Forecast Value |
|
| Revenue (Best Case) | Actual Value + Forecast Best Case Value |
||||
| Revenue (Worst Case) | Actual Value + Forecast Worst Case Value |
||||
| 3 | Actual | Displays Actual Revenue for your selected Forecast Version. | (Revenue Pending Recognition Value + Revenue Recognized To Date Value)
|
Revenue Pending Recognition Value = Equal Split Milestone Pending Value +
Equal Split Project Pending Value +
Expense Pending Value +
Milestone Pending Value +
Misc Adjustment Pending Value +
Percent Complete Milestone Pending Value +
Percent Complete Project Pending Value +
Timecard Pending Value
|
|
| 4 | Forecast | Displays forecasted revenue for your selected Forecast Version and Case. | (Scheduled Revenue Value + Unscheduled Revenue Value)
|
|
|
| Forecast (Best Case) | Displays forecasted revenue for your selected Forecast Version and Case. | (Scheduled Revenue Value + Unscheduled Revenue Value)
|
|
||
| Forecast (Worst Case) | Displays forecasted revenue for your selected Forecast Version and Case. | (Scheduled Revenue Value + Unscheduled Revenue Value)
|
|
||
| 5 | Chart Legend |
Legend for the information displayed on the chart, which consists of the following:
|
As above, see (3) | ||
| 6 | Scheduled (Legend) | Displays Scheduled Revenue for the displayed month. | Scheduled Revenue Value
|
Scheduled Revenue Value = Equal Split Milestone Scheduled Value +
Equal Split Project Scheduled Value +
EvA Scheduled Value +
Milestone Scheduled Value +
Percent Complete Milestone Scheduled Value +
Percent Complete Project Scheduled Value
|
|
| 7a | Unscheduled Project (Legend) | Displays Unscheduled Project for the displayed month. | Unscheduled Project Value
|
Project Unscheduled Value = Percent Complete Milestone Unscheduled Value + Percent Complete Project Unscheduled Value |
|
| 7b | Unscheduled Opportunity | Displays Unscheduled Opportunity for the displayed month. | Unscheduled Opportunity Value
|
Opportunity Unscheduled Value
|
|
| 8 | Forecast Version | Select either a saved Forecast Version or the Live Forecast Version, which is your most recent calculated forecast. Live can be used for current actuals. | Forecast Name
|
||
| 9 | Forecast Version to Compare | Select a baseline forecast for comparison. | Forecast Name
|
||
| 10 | Variance | Calculates the difference between the overlapping periods of the two selected forecasts. | (Forecast Version - Forecast Version to Compare) | ||
| 11 | Variance | Increase/Decrease calculates the difference as a percentage, and then labels if there has been an increase or decrease. | (Forecast Version - Forecast Version to Compare)/Forecast Version to Compare | ||
| 12 | Forecast Version line | Displays only the periods of the Forecast Version that match periods in the Forecast Version to Compare, in a periodic view. | |||
| 13 | Forecast Version to Compare line | Displays only the periods of the Forecast Version that match periods in the Forecast Version to Compare, in a periodic view. | |||
| 14 | View Details | Displays the second page of the Revenue Forecast dashboard, Revenue Forecast Detail. |
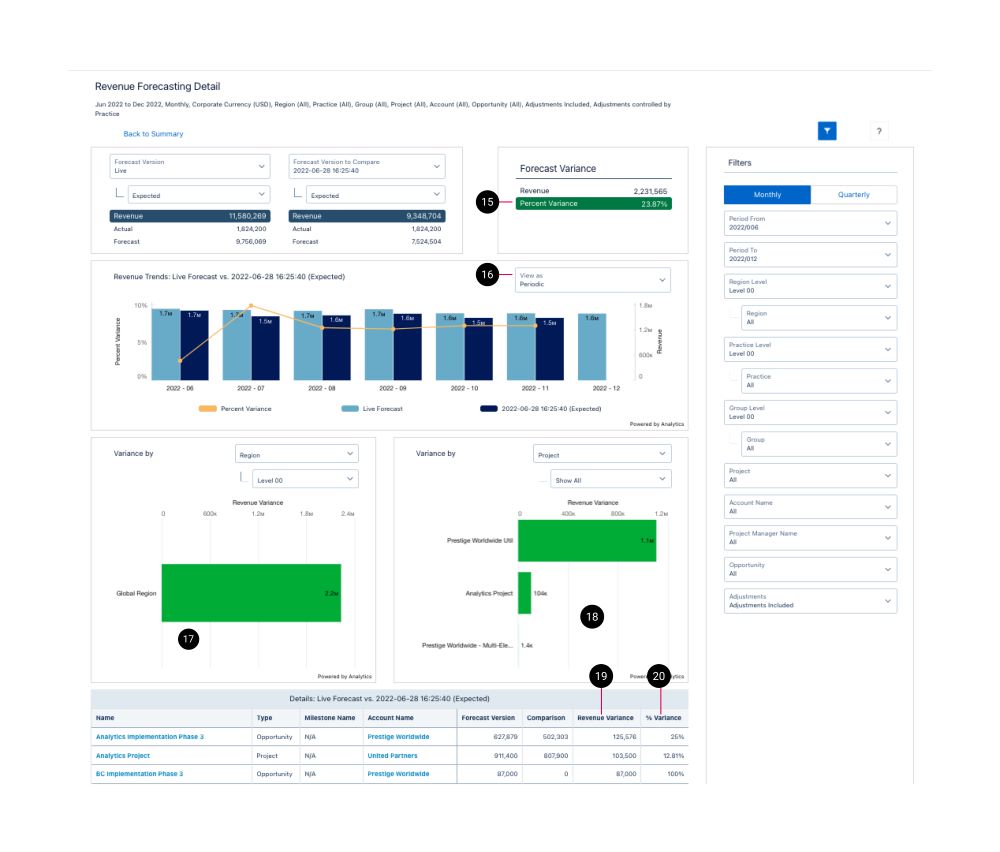
The PSA Revenue Forecast Details view contains the following elements.
|
Element Number |
Name |
Description |
Calculation |
Referenced Calculation |
Source Dataset |
|---|---|---|---|---|---|
| 15 | Forecast Variance (Revenue and Percent Variance) | Shows the difference between the revenue on your current Forecast and the revenue on your Forecast Version to Compare as a percentage of Forecast Version to Compare. | (Forecast Version - Forecast Version to Compare) / Forecast Version to Compare | Revenue =
Total Value (if using expected)
or
Total Best Case Value
or Total Worst Case Value
(Uses the ‘Excl Adjustments’ versions of these measures if adjustments have been excluded on the global filter panel).
|
Revenue Forecast
See Revenue Forecast Dataset PS Cloud Analytics Output Fields for more information. |
| 16 | View As | Switches the view between periodic and cumulative view. | |||
| 17 | Revenue Variance bar chart | The variance between Forecast Version and Forecast Version to Compare broken down by Region/Practice/Group or Project Manager/Project. | Revenue =
Total Value (if using expected)
or
Total Best Case Value
or Total Worst Case Value
|
||
| 18 | Revenue Variance bar chart | Variance between Forecast Version and Forecast Version to Compare broken down by Project/Account MilestoneOpportunity. | Revenue =
Total Value (if using expected)
or
Total Best Case Value
or Total Worst Case Value
|
||
| 19 | Revenue Variance | Shows the difference between current Forecast Version and Forecast Version to Compare in currency. | Forecast Version - Comparison | Revenue =
Total Value (if using expected)
or
Total Best Case Value
or Total Worst Case Value
|
|
| 20 | % Variance | Shows the difference between current Forecast Version and Forecast Version to Compare as a percentage of Forecast Version to Compare. | Revenue Variance / Comparison | Revenue =
Total Value (if using expected)
or
Total Best Case Value
or Total Worst Case Value
|
The filters panel can be used to tailor the data displayed in the dashboard.
|
Name |
Description |
Dataset Field |
|---|---|---|
| Monthly | Displays data by month. |
switches group: by month |
| Quarterly | Displays data in 90 day segments. |
switches group: by quarter |
| Period From | Displays data from a specified date. | Display: Time Period Name
Field used to filter data:
Time Period Start Date |
| Period To | Displays data up to a specified date. | Display: Time Period Name
Field used to filter data:
Time Period End Date |
| Region Level | Displays available levels for regions . | Region Level 01, Region Level 02,Region Level 03 |
| Region | Displays regions at the level selected in Region Level. | Uses field selected in Region Level, shows all values available |
| Practice Level | Displays available levels for practices | Practice Level 01, Practice Level 02, Practice Level 03
|
| Practice | Displays practices at the level selected in Practice Level. | Uses field selected in Practice Level, shows all values available |
| Group Level | Displays available levels for groups. | Group Level 01, Group Level 02,Group Level 03
|
| Group | Displays practices at the level selected in Practice Level. | Uses field selected in Group Level, shows all values available |
| Project | Displays data for a specified project. | Project Name
|
| Account Name | Displays the data for a specified account name. | Account Name
|
| Project Manager Name | Displays the data for a specified project manager name. | Project Manager Name
|
| Opportunity | Displays the data for a specified opportunity. | Opportunity Name
|
| Adjustments | Displays the data with or without adjustments. |
Exclude Adjustments:
Adjustments Only:
|
This dashboard is designed to complement the enhanced Revenue Forecasting Workspace functionality available in PSA. For more information on this functionality, see the PSA Help.
The dashboard is available in the following apps:
- PS Cloud Analytics: PSA Revenue Forecast dashboard
- PSA Analytics Embedded Dashboards: Revenue Forecast (Embedded) dashboard
Prerequisites
This dashboard displays data from the Revenue Forecast dataset and requires access to the following objects in PSA:
- Revenue Forecast Version
- Revenue Forecast Version Detail
- Revenue Forecast
- Revenue Forecast Type
This dashboard is created as part of the PS Cloud Core Analytics app.
Before running the configuration wizard to create the Revenue Forecast dataset, you must carry out the following steps in the Revenue Forecasting Workspace:
- Create Revenue Forecast Version
- Recalculate Revenue Forecast
For more information on how to perform these tasks, see Revenue Forecasting Overview.
The following fields are used to represent different forms of revenue totals in the dashboard:
- Actual Best Case Value
- Actual Worst Case Value
- Adjustment Best Case Value
- Adjustment Value
- Adjustment Worst Case Value
- Forecast Best Case Value
- Forecast Best Case Value (excl Adj)
- Forecast Value
- Forecast Value (excl Adj)
- Forecast Worst Case Value
- Forecast Worst Case Value (excl Adj)
- Scheduled Revenue Value
- Total Value (excl Adj)
- Total Best Case Value (excl Adj)
- Total Value
- Total Worst Case Value
- Total Worst Case Value (excl Adj)
- Unscheduled Revenue Best Case Value
- Unscheduled Revenue Value
- Unscheduled Revenue Worst Case Value
For details of how these fields are calculated, see Revenue Forecast Dataset PS Cloud Analytics Output Fields.
Suggested Use Cases
Explore and visualize the data displayed in this dashboard to answer critical business questions such as:
- How much revenue have we generated to date?
- How much revenue do we expect to generate going forward?
- How much forecast revenue is not linked to scheduled work?
- How accurate has our forecast been compared to our actuals?
Embedding the Dashboard
This dashboard is optimized to be embedded in the page layout for your Revenue Forecasting workspace in Lightning Experience.
For more information on how to embed the Revenue Forecast (Embedded) Dashboard, see Embedding PS Cloud Analytics Dashboards in a Lightning Page.